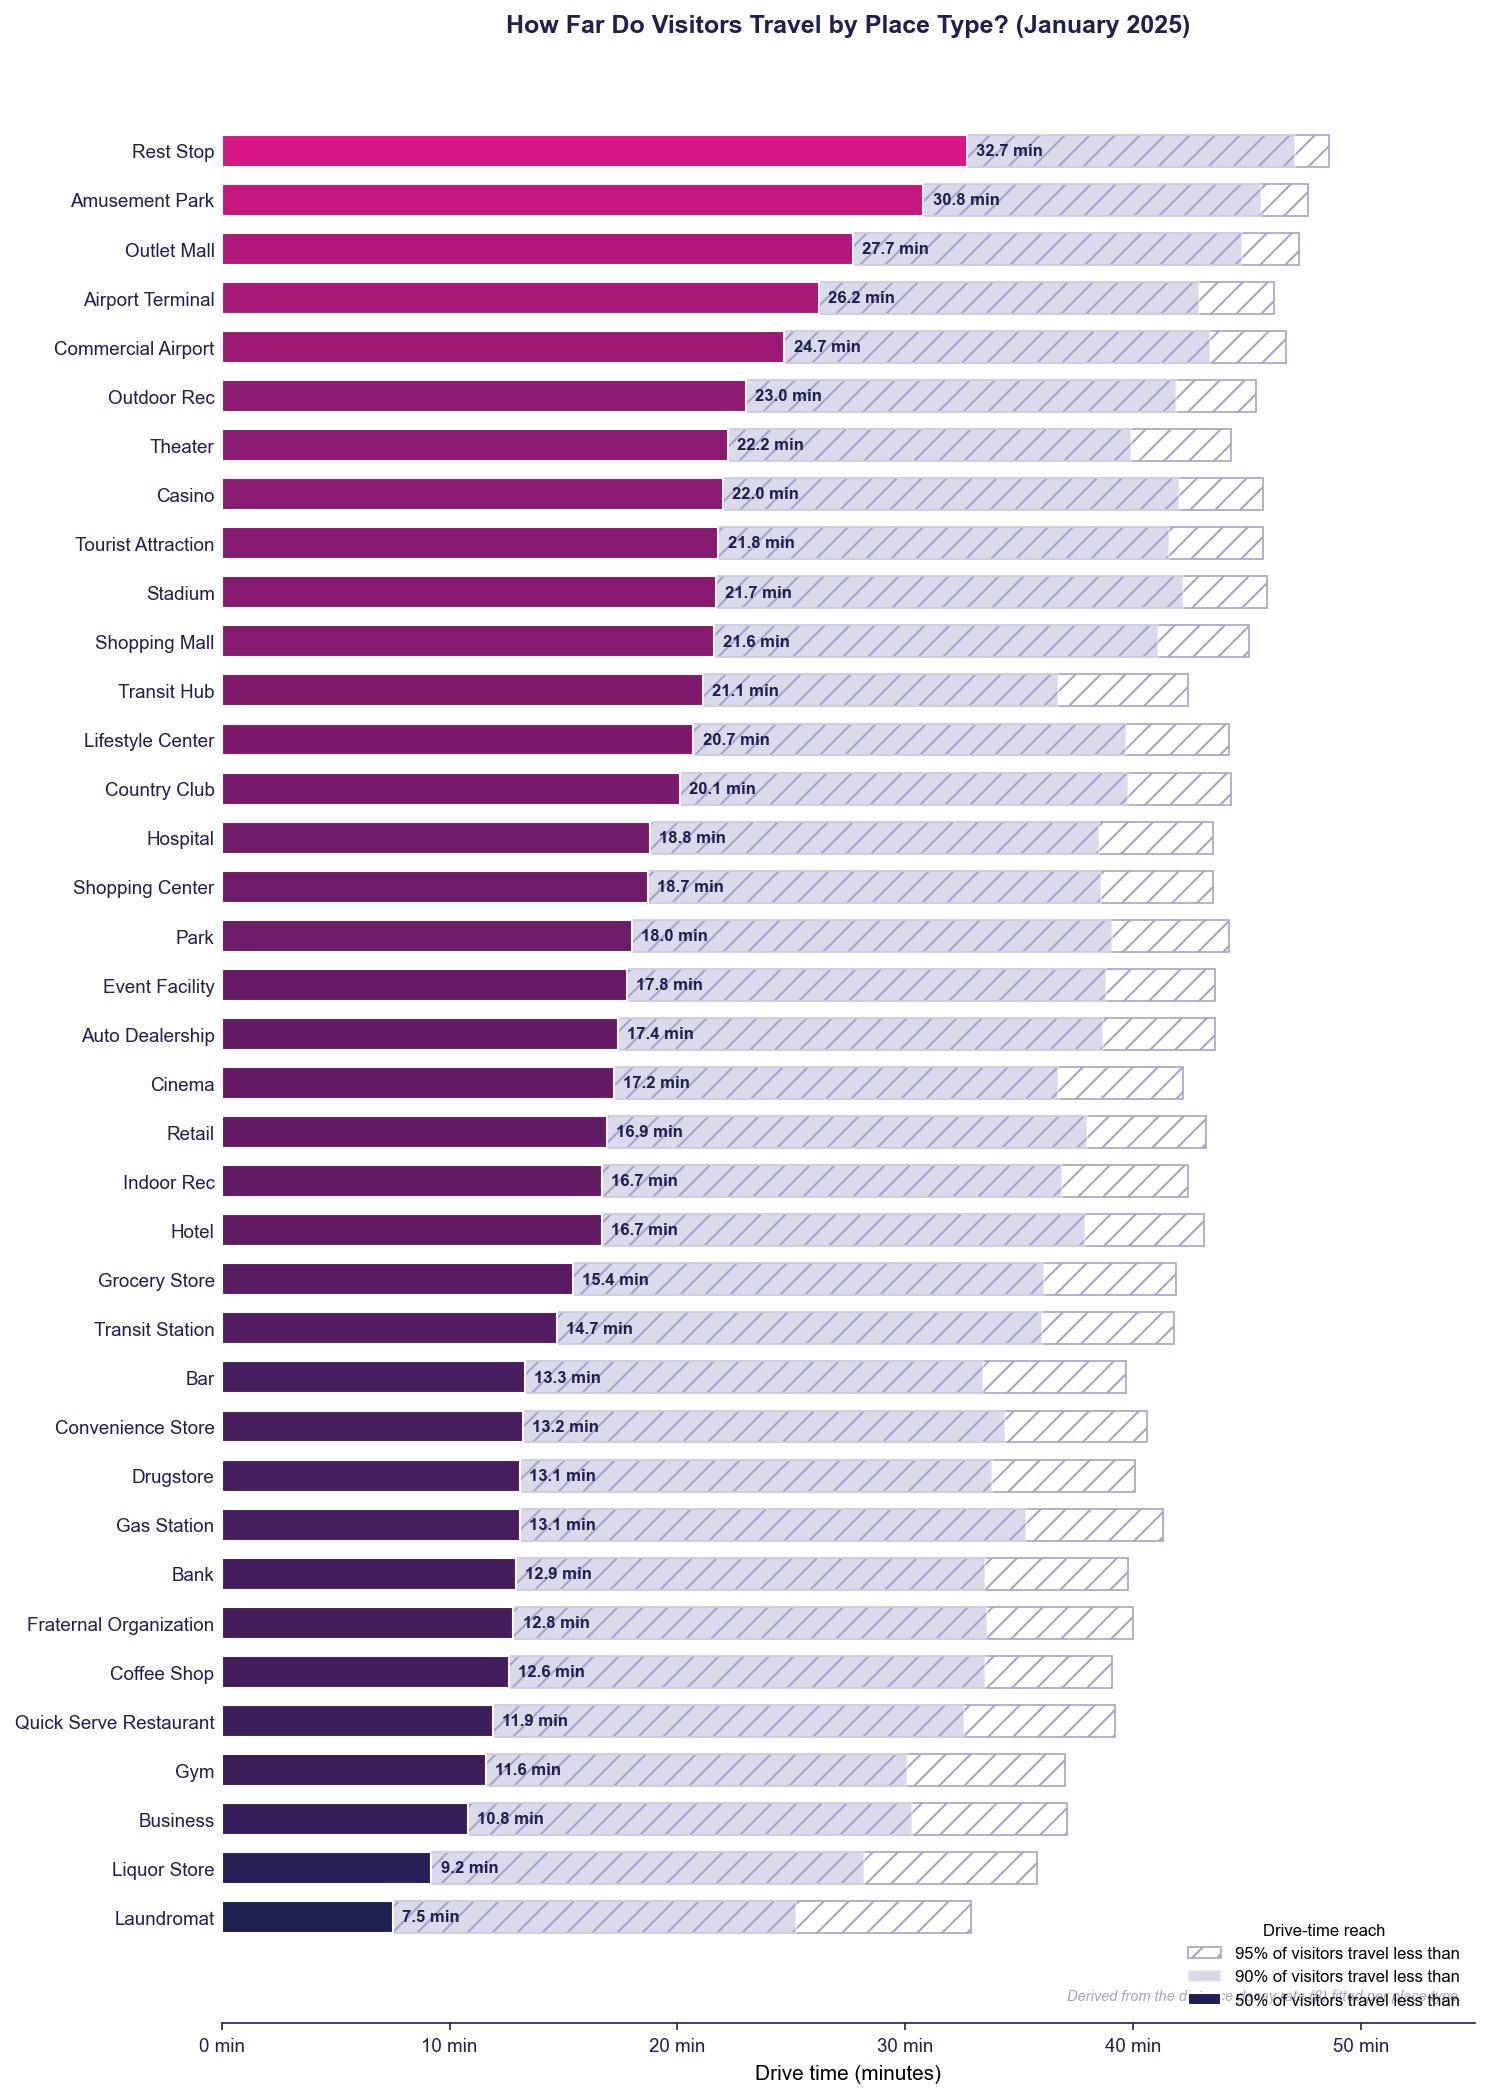
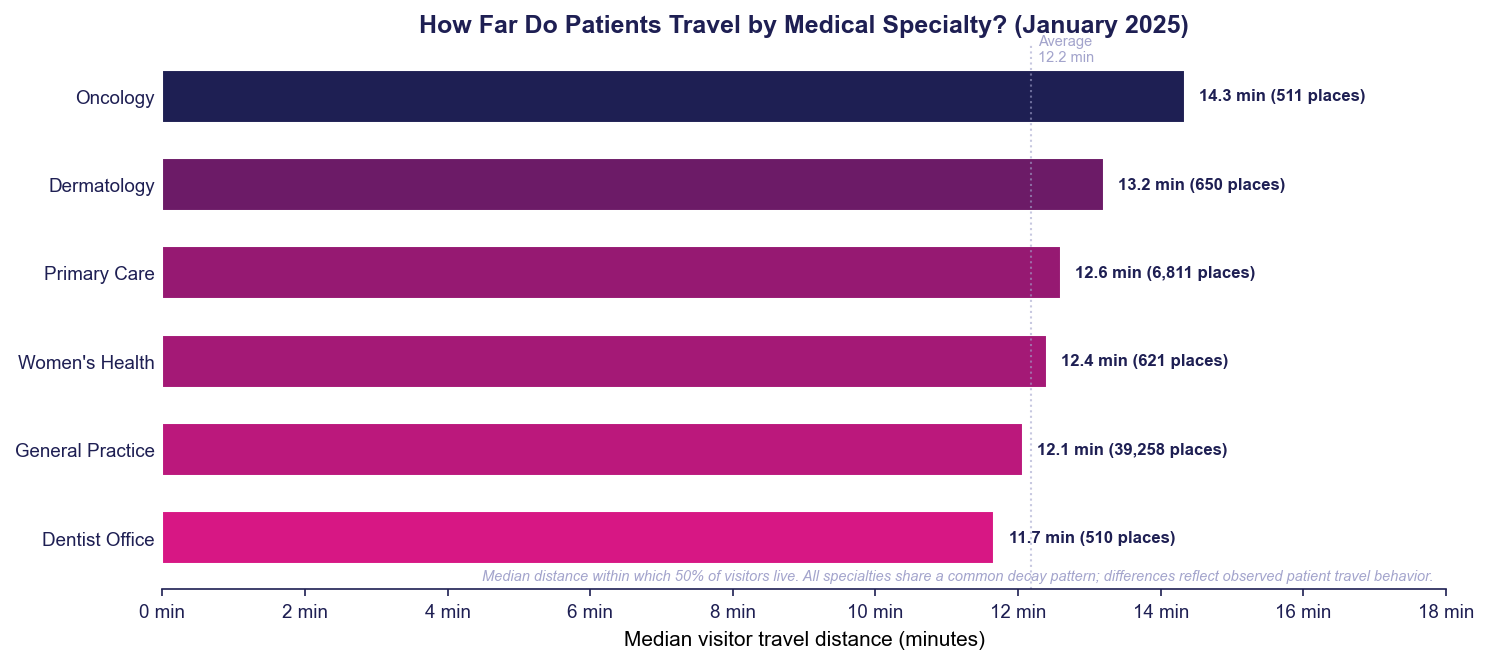
Trade Area Foundation Model · The infrastructure behind every Placecast query

Where every visitor actually comes from.

A trade area is the geographic distribution of a place's visitors — not a radius, but a real visitor origin distribution shaped by roads, transit, density, and place type. Motionworks estimates one for 2M+ places across the United States across 45+ place types, with 20 day-of-week and time-of-day combinations per place. Refreshed monthly. Validated at 94-97% accuracy against an 11-month holdout panel.
Coverage
2.1M places, 45+ types
Geographic grain
Census block group (600-3,000 residents)
Temporal grain
20 day-part cells per place
Refresh
Monthly
2.1M
Places Modeled
45+ place types
Every place gets
a trade area
94-97%
Validated Lift
vs. holdout panel
across all volume
tiers and types
Foundation model powering
Viewcast
Placecast
Popcast
Pathcast
94-97%
of places improved trade area accuracy when tested against an 11-month holdout panel, across all volume tiers and place types.
97%
of places resolve at market-specific parameters (DMA or finer). Only 3% fall to the national fallback pool.
Stable. Complete. Transparent.
Two interpretable parameters drive the model. Every place receives a trade area, regardless of how much direct observation data is available. Consistent month over month, no unexplained swings between releases.
Privacy by construction
All outputs aggregate to the census block group level. No individual device is identifiable in any output. Minimum observation thresholds applied before any block group appears in a trade area.
Validation: 11-month holdout (Feb-Dec 2024 training, Jan 2025 holdout) across Grocery, Bar, and Shopping Center

A gravity model, calibrated locally, blended with observed signal.

People are more likely to visit nearby places, and places near larger populations draw more visitors. The model learns the pattern of how visitor share drops with drive time for groups of similar places, then applies that pattern to every place in the country, including the many places where direct observations are too sparse to measure individually.

Inputs

  • Mobile device home-location panels, consented and opt-in
  • Census block group population (600-3,000 residents per BG)
  • Drive-time matrix from each BG to each place
  • GTFS schedule data for transit stations across 39 agencies
  • Place taxonomy with 45+ types, sub-typed where appropriate

Pipeline

01
Fit pool parameters via weighted least squares on control places. 4-level hierarchy: place type + DMA + urbanicity, with national fallback.
02
Auto-calibrate concentration to match observed effective number of block groups per place type. Two interpretable parameters: beta (decay) and alpha (concentration).
03
Score every place. Cross-join with 20 day-part cells. Apply temporal modulation per cell.
04
Blend up to 20% observed signal where panel coverage is strong. Model contributes at least 80% in all cases.

Pure SQL implementation. No UDFs, no external model artifacts, no ML.PREDICT. The fitting process eliminated 230 tasks from the prior pipeline.

01
Distance decay
Visitor share drops with drive time, but the curve differs by place type.

Visitor share drops with drive time, but the curve differs by place type.

Grocery stores capture nearly all visitors within 5 minutes. Bars hold 50% out to roughly 2 minutes and keep a long tail. The model learns each type's characteristic curve directly from observed visitor data.

How quickly does visitor share drop with distance?

Relative visitor share vs drive time, by place type. Source: Motionworks gravity model, January 2025.
Grocery Store
Convenience Store
Hospital
Sitdown Restaurant
Bar
0%20%40%60%80%100%0 min5 min10 min15 min20 minDrive time (minutes)
DECAY
A grocery store in Manhattan draws from a tighter radius than a gym in the suburbs.
The model captures these differences automatically. It does not impose one-size-fits-all assumptions on visitor behavior.
02
Different places, different reach
Median drive-time reach varies 4x across place types.

Median drive-time reach varies 4x across place types.

Solid bars show the drive time within which 50% of visitors live. The model recognizes that a laundromat serves its immediate neighborhood while an outlet mall draws from across a region.

Median visitor travel distance, by place type

Drive time within which 50% of visitors live. Solid bars only. The 90th percentile tail extends much further.
Destination places (20+ min)
Everyday retail (13-19 min)
Neighborhood services (under 13 min)
0 min10 min20 min30 minRest Stop32.7Amusement Park30.8Outlet Mall27.7Airport Terminal26.2Casino22.0Stadium21.7Shopping Mall21.6Hospital18.8Park18.0Auto Dealership17.4Cinema17.2Hotel16.7Grocery Store15.4Bar13.3Convenience Store13.2Drugstore13.1Bank12.9Coffee Shop12.6Gym11.6Liquor Store9.2Laundromat7.5
03
Temporal variation
A place's trade area expands and contracts by day-part.

A place's trade area expands and contracts by day-part.

The model produces 20 distinct trade areas for every place, one for each day-of-week and time-of-day cell. Grocery stores show mild variation. Bars show nearly 2x between the tightest and broadest slots, because a Tuesday at 1 AM is regulars, while a Friday at 10 PM pulls from across town.

When does the trade area spread or tighten?

Concentration ratio by day-type and day-part. Values above 1.0 mean broader reach (visitors from further away). Values below 1.0 mean tighter, more local.
Grocery StoreMon-ThuFriSatSun12a-5a6a-9a10a-3p4p-6p7p-11p1.051.141.020.960.891.031.111.010.970.921.001.070.980.950.911.021.080.960.940.89
BarMon-ThuFriSatSun12a-5a6a-9a10a-3p4p-6p7p-11p0.740.850.890.971.030.780.860.921.001.070.820.880.951.021.100.790.840.900.960.98
Broader (visitors from further) Tighter (more local)
2x
Bars vary nearly 2x between the tightest and broadest slots. Grocery stores barely move.
A Tuesday at 1 AM is regulars from the neighborhood. A Friday at 10 PM is people traveling across town for nightlife. The model produces 20 distinct trade areas per place to capture this.
04
Geography shapes the trade area
Urban grocery stores draw from 10 minutes. Rural stores reach 19.

Urban grocery stores draw from 10 minutes. Rural stores reach 19.

Within a single place type, the gradient from urban core to rural town nearly doubles the median trade area reach. The model fits separate parameters for each urbanicity classification rather than applying a national average.

Median trade area reach by urbanicity and place type

The model recognizes five levels of density rather than a binary urban-rural split.
Grocery Store
Convenience Store
Bar
Sitdown Restaurant
05101520253010101516Urban13121619Metro13151720Suburban16161922Town19212326RuralUrbanicity classification

A grocery store in LA reaches 10 minutes. In Atlanta, 15.

Within the same urbanicity class, dense coastal metros produce the tightest grocery store trade areas. Sprawling Southern metros extend nearly 50% further. Difference is learned from observed visitor data, not assumed.

Grocery store trade area reach by metro

Dot size proportional to number of control stores in DMA.
0 min5 min10 min15 minAtlanta15.1 minRaleigh-Durham15.0 minCharlotte14.8 minWashington DC13.9 minBoston13.7 minChicago13.3 minSeattle13.0 minDallas-Ft. Worth12.7 minTampa12.1 minPhiladelphia12.1 minPhoenix12.0 minNew York11.9 minSan Francisco11.6 minLos Angeles10.2 min
05
Transit station trade areas
A transit station's trade area looks like a nervous system, not a circle.

A transit station's trade area looks like a nervous system, not a circle.

Walk into Penn Station and you could be from Long Island, central New Jersey, or Westchester. Trade areas for transit stations follow the network, not concentric distance. Within 15 minutes of a station, walking dominates and the local neighborhood prevails. Beyond that, transit travel time along corridors carves out distinctive shapes that no radius could ever capture.
naive radius
NYC Subway (G train)
Bedford-Nostrand Avs
Brooklyn, NY
702 block groups
Follows G train corridor through Brooklyn and Queens.
naive radius
NYC Subway (4, B, D)
Yankee Stadium
Bronx, NY
1,900 block groups
Three lines feed in. Trade area extends across Bronx, Manhattan, and into Brooklyn.
naive radius
Metra commuter rail
Ogilvie Transportation Center
Chicago, IL
429 block groups
Three Metra lines radiate northwest, north, and west into the Chicago suburbs.
naive radius
Metro Rail + Metrolink
Union Station
Los Angeles, CA
373 block groups
Trade area appears as discrete islands along Metro Rail and Metrolink corridors.
15 MIN
Inside 15 minutes, walking dominates. Beyond that, the network takes over.
The model uses GTFS schedule data from 39 transit agencies to generate transit-aware travel times. Penn Station's 2,500-block-group trade area fans into NJ Transit territory and across Long Island. A radius would have caught water and air.
06
Specialties within a category
Two medical offices in the same building can have different catchments.

Two medical offices in the same building can have different catchments.

Specialists with fewer locations per metro draw from wider areas because patients have fewer nearby alternatives. Routine-visit practices like dentist offices are abundant and evenly distributed, so visitors choose the nearest one.

How far do patients travel by medical specialty?

Median visitor travel distance. Specialists with fewer locations draw from wider areas.
0 min4 min8 min12 min16 minavg 12.2Oncology14.3Dermatology13.2Primary Care12.6Women's Health12.4General Practice12.1Dentist Office11.7
3.7x
A primary care office draws from 12.6 min. An oncology practice in the same metro draws from 14.3 min.
Two medical offices in the same building can have fundamentally different visitor catchments. A site selection analysis that treats all medical offices identically would overestimate the routine practice and underestimate the specialist.
07
Pool hierarchy
97% of places resolve to market-specific parameters.

97% of places resolve to market-specific parameters.

Each place is assigned to the finest parameter pool with sufficient control places. The cascade tries DMA + urbanicity, then DMA, then urbanicity, then a national fallback. Most places land at the metro level, where the model can capture local road networks, density, and shopping behavior.

How are 2,100,321 places assigned to parameter pools?

97% of places use market-specific parameters. Only 3% fall to the national fallback.
62%P221%P314%P1P4
P2 - Metro level (DMA) 1,305,572 (62%)
P3 - Urbanicity level 445,198 (21%)
P1 - Metro + Urbanicity 283,975 (14%)
P4 - National fallback 65,576 (3%)
08
Gravity model vs. Decision Tree
40-70% tighter, more accurate trade areas than the prior model.

40-70% tighter, more accurate trade areas than the prior model.

The gravity model replaces a decision-tree approach validated across 53 place types. The new model produces results that match how visitors actually behave, not how a tree split happens to slice the feature space.
Grocery Store
Median visitor distance
Decision Tree
7.1 mi
Gravity
1.9 mi
Result: 73% tighter — captures real neighborhood draw
Laundromat
Median visitor distance
Decision Tree
8.4 mi
Gravity
1.6 mi
Result: 81% tighter — laundromats are hyper-local
Medical Office
Block groups in trade area
Decision Tree
639 BGs
Gravity
150 BGs
Result: Top-share BG goes from 0.2% (noise) to 3.2% (real signal)
Bank
Block groups in trade area
Decision Tree
30 BGs
Gravity
92 BGs
Result: 3x broader — better coverage of the real catchment
53 TYPES
Validated across 53 place types: 40-70% tighter trade areas than the previous model.
The decision tree model produced visually plausible but statistically loose trade areas — a 7.1-mile median visitor distance for grocery, when the real number is closer to 1.9 miles. Where the old model spread signal too thin (medical offices), the new one concentrates. Where it failed to capture true catchment (banks), the new one expands.
09
Geography adapts automatically
Same model, four very different shapes.

Same model, four very different shapes.

Drop the same gravity model on grocery stores in four different geographies and the trade areas adapt without any manual intervention. The model honors what's actually there: highways, water, terrain, population density.
Urban periphery
Fry's Grocery
Tucson, AZ
140block groups
Trade area skews northwest along the I-10 corridor where the population sits. The southeastern quadrant is desert.
Mountain town
Kroger
Dahlonega, GA
42block groups
Compact shape constrained by Appalachian terrain. Visitors come from valleys, not over ridges.
Gulf of Mexico
Gulf Coast
Rouses
Bay St. Louis, MS
49block groups
Trade area follows the coastline. Cut sharply on one side because half of the radius is the Gulf of Mexico.
Rural lowcountry
Food Lion
Moncks Corner, SC
75block groups
Broad sparse reach across rural lowcountry. Few alternatives means visitors travel further.
SAME
Same model, four very different shapes. No manual configuration.
Population, road networks, water, and terrain are all encoded in the inputs. The gravity model honors them automatically.
10
Signal blending
The secret sauce: gravity + observed signal, blended.

The secret sauce: gravity + observed signal, blended.

96% of places use market-specific parameters. The gravity model contributes at least 80% to every trade area, with up to 20% correction weight from observed device-panel signal where coverage is strong. The result keeps the model's smooth, complete coverage and folds in real observed structure.
The blend
blended_share = w · observed_share + (1 − w) · gravity_share
w = min(0.20, observed_stays / (observed_stays + 2000))
The model floors at 80% gravity. As observed sample grows, w approaches 0.20 — never higher.

Fry's Grocery, Tucson AZ

Model only
89block groups
Smooth, compact core. Misses the rural northwest signal entirely.
Observed only
98block groups
Noisy and patchy, but reveals a real visitor cluster in the rural NW.
Blended (final)
496block groups
Keeps the model's compact core and pulls in the observed NW signal. Best of both.
11
Validation
When measured within the model's drive-cap, capture is near complete.

When measured within the model's drive-cap, capture is near complete.

The model finds the right block groups within its operational range. Across an 11-month holdout panel (Feb-Dec 2024 training, Jan 2025 holdout), 94-97% of places show improved accuracy versus the prior decision-tree model, across all volume tiers and place types.
Place type P25 capture Median capture P75 capture
Bar 98.7% 100.0% 100.0%
Grocery Store 89.2% 95.3% 99.2%
Quick Serve Restaurant 71.6% 88.4% 98.3%

Within-cap capture rate measures the share of observed local visits the model places in the correct block group, when comparing apples-to-apples within the gravity model's drive-cap boundary.

12
Putting it to work
Three workflows across the Motionworks suite.

Three workflows across the Motionworks suite.

Site selection
Cannibalization risk that a radius model misses.
Two candidate locations the same distance from an existing store can have very different overlap with that store's trade area. Trade areas surface the real overlap because visitor patterns follow road networks, population clusters, and competitive geography, not perfect circles.
Audience measurement
A billboard reaches a different audience at 7 AM than at 3 PM.
Weekday morning visitors come from a broader area as commuters stop en route. Evening visitors are concentrated locally. Media planners can size the reachable audience for each daypart rather than assuming a single static footprint.
Competitive analysis
Competing stores three miles apart can draw from opposite sides of town.
Store A draws heavily from the north due to a highway interchange. Store B draws from the south where a residential development feeds foot traffic. Equal-radius circles miss this entirely.
Why this matters

Trade area accuracy is foundational. Site selection, media planning, and competitive analysis all start with the question of where visitors come from. Get it wrong and you target the wrong neighborhoods, misallocate spend, and make real estate decisions on incomplete data. The Motionworks trade area model is the spatial substrate underneath every Motionworks measurement product.