MRC OOH Standards – Potential to Affect the Effectiveness of the Medium

Posted on: June 25th, 2024 by Ryan Kinskey

A guest blog from Euan Mackay, Chief Strategy Officer at Route Research, the research organization responsible for providing audience estimates to the out-of-home industry in Britain.

Note from Kym Frank: As noted in the prior Motionworks Blog (MRC OOH Measurement Standards: Behind the Numbers – Static Impressions), the systematic (but inconsistent) increase in impressions generated as a result of the transition from likelihood-to-see impressions (LTS) to opportunity-to-see impressions (OTS) as recommended in the new MRC Standards for OOH, will inevitably have the result of decreasing the effectiveness of OOH in market mix models, conversions studies, and other ROI analysis. I am grateful to Euan Mackay for sharing his thoughtful exploration of the math behind this inevitable outcome of the inflation of the medium’s impressions.

Euan has been a pivotal member of the team at Route for the last 8 years. Route is an organization that is similar to Geopath in Britain, where they enjoyed a 16.4% increase in ad spend for Q1 in OOH. He has more than 2 decades of experience in marketing and media research with prior leadership positions at Kantar Media and Crowd DNA.  

New Standards for Out of Home (OOH) measurement published by the Media Ratings Council (MRC) have fairly wide-ranging implications for those trading within the industry. While cross-media comparability is nice in theory, it does bring about several potential challenges for those already operating and trading in the medium.

Kym Frank’s excellent walk-through on the implications on cost per thousands (CPMs) arising with a “softening” of the audience definitions for OOH and moving from the existing likelihood to see ads to a looser (and bigger) number who have an opportunity to see the ads is absolutely fundamental and needs to be closely considered by anyone active in this space, particularly those with the “best” (biggest, most premium) inventory.

Should the industry be on board with this, and decree that bigger numbers are always better and that the likelihood to see (LTS) can be used as a “quality score” to help justify premium pricing strategies, then the next consideration is how this change affects the effectiveness of the medium.

The desire for accountability in media planning has never been higher. Focus has shifted to outcome based marketing and unprecedented demand to demonstrate return on investment (ROI) on media spend.

Barely a day goes by without an Econometric / Mixed Media Modelling (MMM) study demonstrating the relative effect that each component part of the media mix has on generating returns.

It’s also no secret that for a long time, OOH has performed badly in these sort of studies. This is largely as a result of the lack of granularity of OOH data which feeds into these models. In many instances OOH is represented by national spend, rather than any audience data.

Recent work in the UK by JCDecaux and Talon has demonstrated that the use of granular audience data from Route (the Geopath equivalent Joint Industry Currency for OOH audience measurement in Great Britain) can help to improve the effectiveness of OOH in MMM models by 42%.
In a nutshell, if you can feed in high quality, granular audience data which is based on people who are most likely to have seen the ads which cost money, the more likely you are to be able to associate / correlate movements in audience and movements in sales.

So the question is therefore, if the definition of “audience” for OOH changes and becomes looser (as the MRC is advocating) then how would this affect the models which determine effectiveness?

Taking the complex data science mechanics out of how the various models actually work and instead taking a simple conceptual view on this we could have a situation as follows:
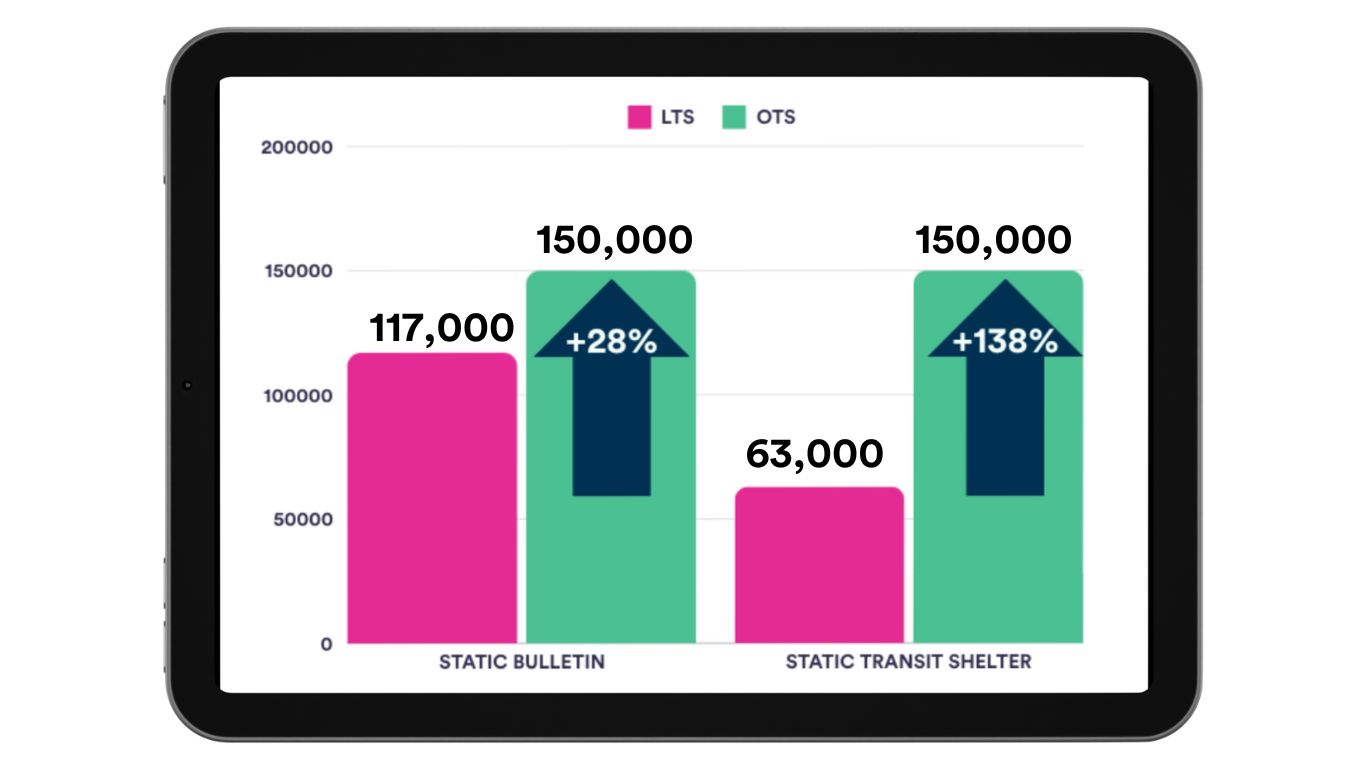
The outcome of opening up the definition is that a larger “audience” number feeds into the effectiveness evaluation calculations… however the amount of sales generated is not affected and neither is the number of people who actually see the ad.

Therefore, in the current LTS situation, 5m impacts lead to $5m revenue ($1 per impact ROI). Yet, in the proposed Opportunity To See (OTS) situation, 10m impressions still lead to $5m revenue which means $0.50 per impression ROI).

So, the potential outcome of the proposed MRC change in definition is a negative impact on the effectiveness of the medium as a whole.  By introducing a larger “audience” number into the inputs, you reduce the efficiency of the medium in the outputs of the evaluations.

In this instance we reduce it by half, meaning you need to buy twice as many OTS to do the same thing that you did previously, which then forces the CPMs down as advertisers want outcomes not potential audiences.

While the carrot of cross-media comparability is strong and absolutely requires some consideration (noting that whether these standards bring the medium closer to comparability at all is questionable), the stick of reduced efficiency and effectiveness of the OOH medium in terms of delivering outcomes for advertisers is something which the industry needs to understand fully before adopting ‘impressions’ as a metric wholesale.

If you would like to get involved in this conversation, if you have questions for Euan, or would like to discuss how the standards may impact your business, we would love to hear from you. Please contact [email protected]

MRC OOH Measurement Standards: Behind the Numbers – Static Impressions

Posted on: June 3rd, 2024 by Ryan Kinskey

The first in a series of forthcoming analysis on the impact of the MRC OOH Measurement Standards — outlining the transformative changes and potential outcomes all OOH media stakeholders – advertisers, media owners, and agencies – should be considering as the industry of the real world evolves and competes in a digital media measurement environment.


Author’s Note:
Over the last few years, the majority of my time at Motionworks has been spent developing innovations in television and radio measurement. My career has always centered around media research across various channels, but having spent 6 years at the helm of Geopath, Out-of-Home holds a special place in my heart. I was one of the many participants in the development of Phase 1 of the MRC OOH Measurement Standards – which will serve as the benchmark for the industry until Phase 2 is introduced. Therefore, I believe it is crucial for the OOH industry—both buyers and sellers—to understand the impact of these standards on the currency and their businesses. This knowledge will position them for success in this evolving landscape.

*The percent increases for both formats were updated on 6/5/24 as there was a miscalculation present from a prior version of this publication.

The MRC Measurement Standard Timeline

In April 2024, after five years of development, the Media Rating Council (MRC) released a set of standards for Out-of-Home (OOH) measurement. Much like the Out-of-Home Advertising Association’s (OAAA) Measurement Guidelines that were released in May of 2021, the MRC standards suggest a move away from the current global gold standard of measurement, Likelihood-to-See (LTS), and towards a less stringent Opportunity-to-See (OTS) metric that does not include the steps required to measure the audience consuming the advertising message.

MRC President George Ivie has announced that a second phase of the OOH standards is expected within the next year, aiming to refine these measures beyond, as he put it in a recent MediaPost article, “The Lowest Common Denominator.” However, there has been limited public discussion on the way in which Phase 1 of these standards might affect the OOH impression metrics used in transactions today and how businesses can prepare for these changes.

Critically, Euan Mackay, Chief Strategy Officer at Route Research, pointed out that important factors to OOH measurement are contradictory or ambiguous within the standards, particularly regarding directionality and the precise development of viewsheds. For our analysis, we will overlook these complexities and concentrate on the implications of applying these standards.

The New MRC OOH Measurement Standards Implications

A hypothetical (but realistic) example:

Consider a Static Bulletin and a Static Transit Shelter both appearing along the right-hand side of the same stretch of roadway…

The bulletin is the standard 14 ft X 48 ft and the shelter is 6 ft X 4 ft. Please consider the following image for the difference in scale of these two inventory types:

On this hypothetical stretch of road, there are 100,000 vehicles in an average week traveling in the correct direction to see the advertising. Assuming each vehicle carries 1.5 people, this results in a weekly circulation of 150,000 people passing by the two media locations.

The larger bulletin is visible from 1,000 feet away, while the transit shelter is only visible from 100 feet. At a speed of 30 miles per hour, individuals are within viewing distance of the bulletin for 22.7 seconds and the transit shelter for 2.3 seconds.

Despite the longer dwell time and larger size of the bulletin, both the bulletin and the transit shelter have identical Opportunity-to-See (OTS) metrics. This uniform metric does not accurately reflect the different abilities of these media to convey the advertising message to the audience.

To address this discrepancy, the OOH industry globally and in the US has applied a probability of noting to each location. In the US, this probability metric is called the Visibility Adjustment Index (VAI). This metric, known globally as Visibility Adjusted Contact (VAC) and referred to by Geopath in the US as an “audience impression” or “Likelihood-to-See (LTS) impression,” accounts for various factors. These include size, distance, dwell time, relative orientation, and location within the field of view, all based on eye-tracking studies. The probability of noting represents the percentage of people likely to look at the advertisement given the opportunity.

For this exercise, let’s assume the probability of noting for the bulletin is 78% and the transit shelter is 42%. The resulting LTS impressions for these formats for an average week are:

An OTS metric removes these adjustments. As a result, the ‘impressions’ on these two formats both end up being greater, but they also end up being identical:

The increase in impressions is not uniform across different formats. In this example, the static billboard sees an increase of 28%, while the transit shelter receives a 138% increase.*

To reiterate, using OTS metrics, a static transit shelter, which covers 24 square feet, registers the same number of impressions as a much larger static bulletin that spans 672 square feet—a 28-fold difference in size. This highlights significant disparities in how impressions are calculated and reported under the new standards. Adding in the complexities of digital media, the disparity between OTS and LTS becomes even more extreme.

Potential Outcomes of OOH Industry Adoption of MRC Measurement Standards

The significant shift in measurement standards could profoundly impact the Out-of-Home (OOH) advertising channel, raising several pressing questions:

It’s important to note that these scenarios assume the continued use of established viewsheds and traffic directionality as per Geopath’s current methodology. Any changes to these elements would likely amplify the impact of the new standards even further.

As the OOH industry navigates through these transformative measurement changes, it is essential for all stakeholders—advertisers, agencies, and media owners—to actively engage with the evolving standards and get involved with the writing of Phase 2. The shift from LTS to OTS metrics not only recalibrates how impressions are calculated but also prompts a reevaluation of strategy across the spectrum of OOH advertising.

Together, through collaborative efforts and a commitment to understanding these new metrics, the OOH industry can continue to thrive in a landscape with increasing data fragmentation, technological advancements, new formats, and greater competition.

If you would like to get involved in this conversation or discuss how the standards may impact your business, we would love to hear from you. Please contact [email protected]


Helping SMBs Make Intelligent Media Investments

Posted on: September 15th, 2023 by Ryan Kinskey

Borrell Associates released a new report this week about the growing optimism of small and medium-sized businesses (SMBs) entering the second half of 2023.

Borrell Associates specializes in tracking, analyzing, and forecasting advertising and marketing investments by local businesses across the United States.

According to Borrell, local advertising will grow 4.4% in 2024, reaching $157.1 billion. While a significant portion of this growth can be attributed to digital formats, many traditional media channels are stabilizing or growing.

The press release highlights growth across the following local media formats:

Borrell attributes the growth in traditional formats to local businesses becoming increasingly savvier when it comes to media investments.

A vital aspect of being a savvy marketer includes having access to the right data to empower intelligent decision-making. Motionwork’s® mission is to make population mobility data and location intelligence more accessible and actionable to a greater variety of teams, communities, and enterprises. – and that includes small and medium-sized businesses.

Motionworks® provides a comprehensive suite of privacy-compliant solutions that can empower SMBs to make even more powerful marketing decisions, optimizing the investment of their media budgets, and maximizing the ROI on their ad spend.

Utilizing Motionworks® Population Intelligence, your company can:

If you are interested in learning more about how Motionworks® can empower you to make better marketing and business decisions for your SMB, please reach out to us at [email protected]. We would love to learn more about your company, your needs, and help maximize the potential of your local ad spend.


Motionworks® Primer Series: Synthetic Populations

Posted on: August 15th, 2023 by Kris Bravo

Motionworks® Primer Series: Synthetic Populations

Machine learning and artificial intelligence are valuable techniques to speed up processes, lower costs, and provide more accurate solutions. In addition, they provide better insights to inform businesses and improve infrastructure in industry verticals such as urban planning, retail, finance, real estate, advertising, marketing, autonomous vehicles, and travel and tourism.

The amount of data required to train these models properly is massive. In order to overcome this obstacle, companies utilize “synthetic data.” By training models with synthetic data, companies are able to overcome challenges such as incomplete datasets, privacy issues, data cleansing, and more. Motionworks® uses a specific type of synthetic data to fuel its Population Intelligence – synthetic population data.

This primer will help you understand everything you need to know about Motionworks’® use of a synthetic population to generate mobility data.

Motionworks® has developed an innovative and cutting-edge approach to population intelligence, revolutionizing the way we harness data for insights. Central to our methodology is the strategic integration of a synthetic or digital population.

It’s important to note that the term “synthetic” may raise eyebrows, suggesting a sense of artificiality, but in reality, this couldn’t be further from the truth. Let’s explore.

What is a Synthetic Population?

A synthetic population, also known as a digital population, is a duplicate of the real population often generated by machine learning or artificial intelligence (AI).

The incorporation of synthetic data stands as a legitimate and often-used technique, garnering widespread adoption and implementation across diverse industry verticals. From optimizing pivotal business decisions to enhancing urban infrastructure, fortifying financial safeguards, fostering improved health outcomes, and more. Synthetic data has emerged as an indispensable tool driving progress in the world of research and analytics.

In today’s dynamic landscape, where companies often their research solutions as comprehensive portrayals of the total population, the truth is that representing the complete spectrum of society in a responsible and accurate manner presents formidable challenges. Even in the unlikely scenario that a business was to acquire all the deterministic mobile data accessible in the United States, it would still represent a mere fraction of the movement of the total population.

By artfully interweaving real-world data with a meticulously crafted synthetic population database, Motionworks ®transcends the limitations of conventional approaches. Through the synergy of real-world and synthetic data, we chart a course towards a more nuanced and profound understanding of human mobility and behaviors without the need for skirting ethical issues and privacy regulations.

How is a Synthetic Population Developed?

In order to create a synthetic population, Motionworks® takes the information that it knows about each census block group – such as the demographics and distribution of the people who live there. Then, using artificial intelligence, Motionworks® creates a fully representative model of the total population. The synthetic population looks like the real population in all the ways that are important to Motionworks®, including age, income, ethnicity, gender, and how many people live in each dwelling.

The concept of a synthetic population may seem a bit confusing, but it is very similar to what is happening in some of the most common consumer-focused artificial intelligence applications today.

Many people are familiar with online art generators that are powered by AI, such as Nightcafe.

In order to create these applications, AI models are fed countless images of artwork that were created by real humans. After rounds and rounds of machine learning, the AI gets better and better at creating its own synthetic artwork, and eventually, it is nearly impossible to tell the difference between the synthetic art created by AI and the art created by humans.

A simple prompt of “a beautiful sunset in autumn” generates a piece of art that contains all of the elements of a sunset in autumn, the sky, trees with amber leaves, clouds – but it was synthetically generated. This is very similar to the way a synthetic population is created. A synthetic population looks, feels, moves, and behaves just like the real population.

Synthetic Population in Action: An Example

Imagine that a city wants to understand what will happen to the traffic flow if adds toll booths every two miles on the highway. Rather than building the toll booths and then dealing with real life repercussions, the toll booths can be “built” in a simulated environment.

Since the synthetic population still needs to get to work on time and pick up the kids after school, they will still go about their day, but will encounter the synthetic toll booths, which will then impact how long it takes them to get to their destinations. The simulated people may opt to take an alternate routes or leave earlier in the morning. Their may be traffic jams, slow-downs, an influx of traffic on bridges and tunnels, or increased traffic on residential streets. The impact of this many tolls in such proximity, would undoubtedly have an impact on the flow of traffic throughout the city as well as the drain on the city’s infrastructure.

Utilizing a synthetic population, the city is able to understand the impact of the tolls without ever having to build a single booth. In fact, the city can test multiple permutations of installations – varying the count and distance of toll booth installations and can use the insights generated to make better infrastructure decisions on behalf of its residents.

Motionworks® utilizes its Synthetic Population to help predict real world outcomes when hypothetical changes are made to the way people move about their day. These changes may be toll booth installations such as those discussed above, or may involve situations such as emergency city evacuations, double of the population in a geography, building a new shopping center, or installing public transportation options. We call this “Futurecasting.”

The Advantages of Using a Synthetic Population

There are many important reasons that Motionworks® utilizes a synthetic population as a core part of its methodology including:

Privacy.

Motionworks® is committed to providing insights in an anonymized, aggregated, and privacy-compliant way across all of our solutions. Motionworks® data does not provide insights into individual behaviors and cannot be reverse-engineered or manipulated to provide such information. Utilizing synthetic populations to understand population behavior is recognized as a process that preserves the confidentiality of individuals while providing realistic, representative data outputs.

Total Population Metrics.

The Motionworks® approach is developed to measure everyone, everywhere, all the time, rather than measuring device activity within a target polygon. There is no source of deterministic data available today that can provide persistent, accurate information on the location of every individual in the country. Only through the use of a synthetic population derived from a large deterministic data sample is total population measurement achievable.

Granularity.

The Motionworks® data set that is produced from this synthetic population reflects where everyone in the country is at any given moment in aggregation, allowing the data to be cut in a variety of ways and geographic resolutions while maintaining integrity.

How Synthetic Populations Are Validated

Motionworks® validates its Synthetic Population against multiple datasets in each geography. In the United States, it is validated against the US Census and Claritas Popfacts. In Canada, it’s validated against the Canadian Census and Environics Analytics. Our synthetic population aligns very closely with these datasets. More detailed information on our validation is available for the United States and Canada.

Key Use Cases of Synthetic Populations

It’s not just Motionworks® that uses synthetic population analytics. Many major companies are using this type of data to make better business decisions daily.

Marrying Synthetic Data with Real Data to Generate Population Intelligence

Our work does not stop with the generation of the Synthetic Population dataset, although many clients may find that database a worthwhile product on its own.

Motionworks® layers other datasets onto the Synthetic Population database to curate our Population Intelligence solutions. These include:

Conclusion: Summarizing Motionworks’ Use of Synthetic Populations for Comprehensive Location Measurement

The use of synthetic data sets is growing in popularity across multiple industry verticals. In fact, Gartner predicted in the Wall Street Journal that “By 2024, 60% of the data used for the development of AI and analytics projects will be synthetically generated.”

Motionworks® stands as a beacon of privacy-conscious measurement. Our commitment to anonymized and aggregated insights that represent the full population, coupled with the pioneering use of AI to generate synthetic populations and population intelligence reshapes the mobility data landscape.

For more information about how Motionworks® utilizes synthetic populations and how we can put our insights to work for your business, please reach out to us at [email protected].


Motionworks® Launches Placecast® Trade Areas – Now Available in the Snowflake Marketplace

Posted on: July 12th, 2023 by Ryan Kinskey

Motionworks® is excited to now provide its Placecast® Trade Areas data in the Snowflake Marketplace! This valuable dataset can answer questions such as:


Placecast® Trade Areas has a variety of use cases, including:

Market Analysis

Placecast® Trade Areas can determine whether targeted advertising campaigns resulted in increased foot traffic from specific neighborhoods, providing insights into the effectiveness of local marketing strategies.

Location Planning

Placecast® Trade Areas provide valuable insights into customer travel distances and identify underserved neighborhoods for optimized real estate site selection. By determining the distance customers are willing to travel to a particular location, businesses can make informed decisions about their real estate choices. Additionally, Placecast® Trade Areas help identify areas where businesses are not currently serving customers, allowing them to target those neighborhoods for potential expansion or improvement.

Foot Traffic Analytics

Placecast® Trade Areas can help visitation bureaus understand tourism patterns by providing information about the origin of visitors and any changes in their travel patterns over time.

Location Data Enrichment

Placecast® Trade Areas provides valuable information for market mix models by determining the number of local residents and visitors in a specific market throughout the year. This data helps in analyzing seasonal trends and quantifying non-resident customer opportunities.

For more information, reach out to us at [email protected] or visit us on the Snowflake Marketplace.


Dump the Pump Day – Use Public Transportation

Posted on: June 15th, 2023 by Ryan Kinskey

Today is “Dump the Pump Day”

Since it was launched by the American Public Transportation Association (APTA) in 2006, the third Thursday of June is “Dump the Pump Day.” The aim is to encourage people to break free from their reliance on gasoline-powered vehicles by utilizing public transportation as an alternative for just one day and to bring awareness to the environmental impact of gasoline use.

According to the APTA, every $1 invested in public transportation generates $5 in economic returns, and that every $1 Billion invested in transit results in approximately 50,000 new jobs.

In 2022, the US consumed approximately 369 million gallons of motor gasoline a day according to the Energy Information Administration (EIA).

Transit ridership continues to increase coming out of COVID. Unlinked transit passenger trips for Q1 of 2023 were up 24% versus the same time period in 2022 in the United States. The greatest increase was in commuter rail, which was up 43% year over year. Bus ridership was up 21%.

Canada has also seen an increase in ridership with overall trips up 51%.

Even with these year over year increases, ridership is still down versus 2020 Q1 prior to COVID-19. Unlinked transit passenger trips in the US are still 23% below 2020. Commuter rail is down 30% and buses are down 21%.

Motionworks® mobility data shows that people in the United States are still traveling less miles in an average day than they did prior to COVID-19 (Q1 2023 vs. Q1 2020) but the difference in distance traveled daily varies significantly by market.

For more information on the per capita travel in your market, please contact us at [email protected]


Boosting CMO Confidence In Media Investments

Posted on: January 26th, 2023 by Kris

The CMO Council and NCSolutions recently surveyed more than 160 marketing leaders across North America. The results uncovered a shocking statistic – 2 out of 3 marketing leaders lack confidence in their current media strategy.

What makes the other third of marketing experts confident in their investments?

The survey results demonstrate that there are many ways that CMOs can increase their confidence in their media strategy – most of which are rooted in data.


Measuring Performance

The study found that measuring  Sales lift is the top way marketers evaluate advertising performance (64% of respondents). This was followed by Return on ad spend (ROAS, 59%), Reach of targeted audience (47%), and Brand lift (45%). Reach was the top “audience exposure” metric on the list, with impressions ranking 9th at 23%.

Less than a third of respondents said that they utilize Marketing mix modeling (30%), Multi-touch attribution (28%), and Last-click attribution (22%).

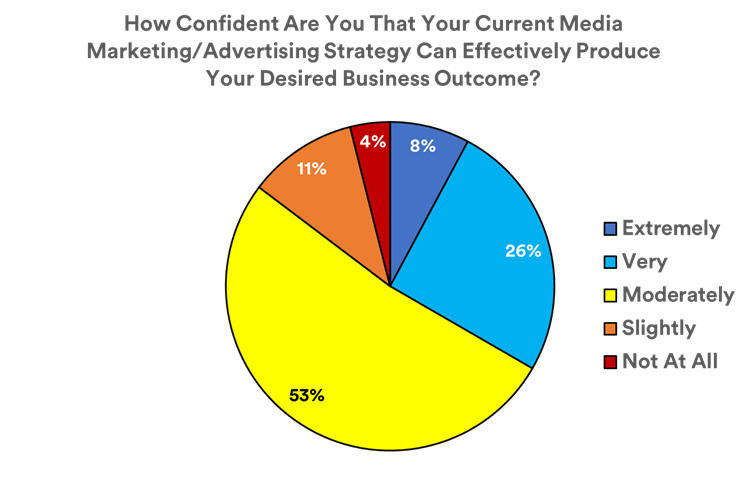
According to this research, offering the right type of outcomes measurement will bolster confidence among media decision-makers – but not all outcome approaches are equal.

The importance of Sales Lift reporting cannot be overstated. 85% of respondents said it is either Extremely or Very Important they are able to obtain a sales lift report when working with a publisher or retail media network.

Attracting New Customers

The study uncovered that marketing leaders feel that marketing and advertising are very or extremely important to winning new customers (80%) and customer retention (52%).

The study recommends personalizing advertising and making brand engagements interactive. As the death of the cookie approaches, this is a unique opportunity for out-of-home (OOH) advertisers to use the advancements in audience targeting data available today. Additionally, OOH is in a superior position to many other media formats to interact with consumers while they are shopping and to curate unique experiences that can drive a customer to an online engagement.

The OOH industry has the capability to measure these interactions and the conversions that follow – whether online or off – to ensure marketing decision-makers have the confidence to invest in the OOH media channel again.


Key Confidence Drivers

The study found key differentiators between those marketing leaders who stated they were confident about their investments and those who did not.

The largest delta was among those who were conducting effective in-flight campaign optimization. 49% of those who said they are confident in their media investments felt that they are high performers of optimization in flight versus only 20% of those who are not confident in their investments.

Other differentiators included customer targeting and measuring campaign performance.

In-flight campaign optimization can be more challenging for OOH than other media channels, but it is certainly a possibility. The availability of near-real time metrics can empower advertisers to understand how their campaign is performing with more recency than ever before, and the ability to move creative, especially on digital formats, is simpler than ever.

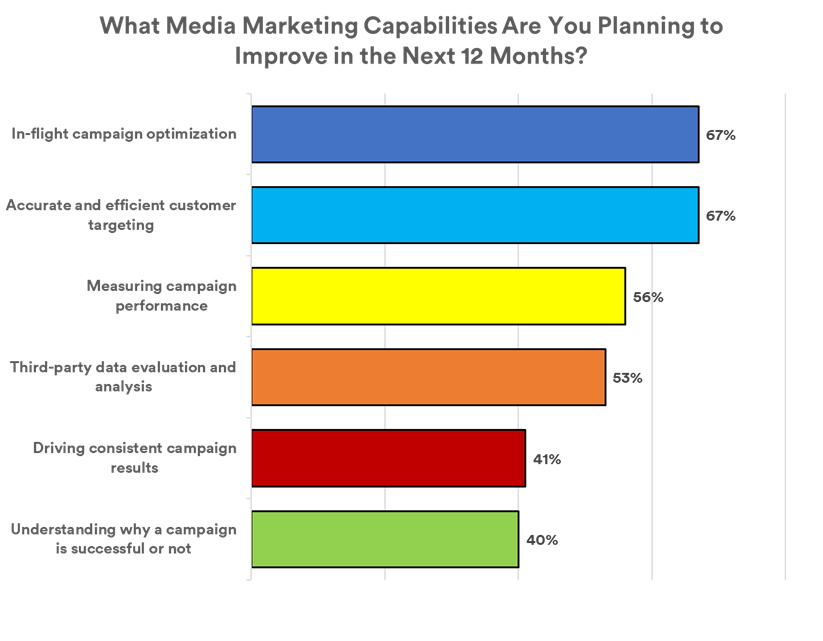
It is important to note that 67% of the marketers surveyed said that they plan to improve their in-flight campaign optimization work over the next 12 months. The growing focus on this practice can be an opportunity for companies in the OOH space who are willing and able to facilitate near-real time measurement and are capable of moving creative quickly and affordably.

OOH Data and The Knowledge Gap

The availability of data to the OOH industry has skyrocketed over the past few years and in some cases, surpassed those available in other media channels. The myriad of measurement methodologies, technological solutions, and increased granularity of metrics can be better leveraged to empower marketers to be more confident in their OOH investments.

Additionally, while the wealth of data available to the industry is undeniable, advertiser and agency knowledge of the existence of that data seems limited. Repeatedly, advertisers speak at industry events about the value of OOH as a channel but are frustrated by the lack of data and measurement solutions – while we, as onlookers in the audience, whisper to each other that the very solutions they are looking for are readily available.

The good news is that the hard part has already been done in OOH. The development, the testing, and the technology to facilitate measurement and analytics already exists. What is left for us to do is inform marketers that we have the tools they need to help drive their trust with data-driven OOH investments.

For more information on the CMO Council and NCSolutions study or to download the complete report, please visit this website.

Motionworks® Introduces Liftcast

Posted on: November 21st, 2022 by Ryan Kinskey

Liftcast can answer a multitude of questions on behalf of businesses, travel destinations, and governmental agencies such as:

Businesses

Destinations

Government Agencies

Contact us for more information on the value that Liftcast can provide to your business via [email protected]

Motionworks® Mobility Update

Posted on: November 18th, 2022 by Kris

Nationally, for the month of September, the average American is traveling approximately 23.4 miles every day.

Daily travel is exceeding September 2019 where the average miles per day was 22.5, a 4% increase. Meanwhile, gas prices are up more than a dollar on average during the same time period, indicating that, while gas prices are high, they do not seem to be impacting the distance that people are traveling every day.

This is good news for advertising channels such as out-of-home and radio as consumers are still on the go.

Motionworks® data show that the miles traveled by the average American daily for 2022 continues to be in alignment with 2021 and 2019.

Gas prices continued to fall from the June peak through September. Motionworks® data show that the average person continues to travel approximately the same distance month over month through Q3.

Gas prices have increased 38% since 2019 (approximately $1).
Miles driven per day are on par with 2021 and slightly more than 2019.