The CMO Council and NCSolutions recently surveyed more than 160 marketing leaders across North America. The results uncovered a shocking statistic – 2 out of 3 marketing leaders lack confidence in their current media strategy.
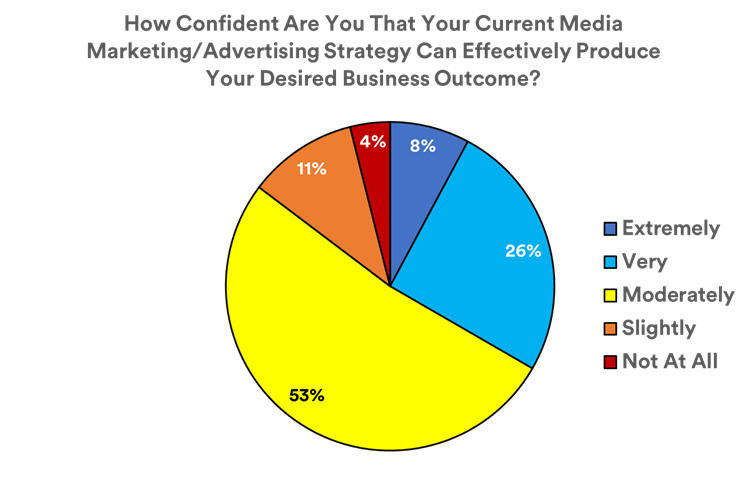
What makes the other third of marketing experts confident in their investments?
The survey results demonstrate that there are many ways that CMOs can increase their confidence in their media strategy – most of which are rooted in data.
Measuring Performance
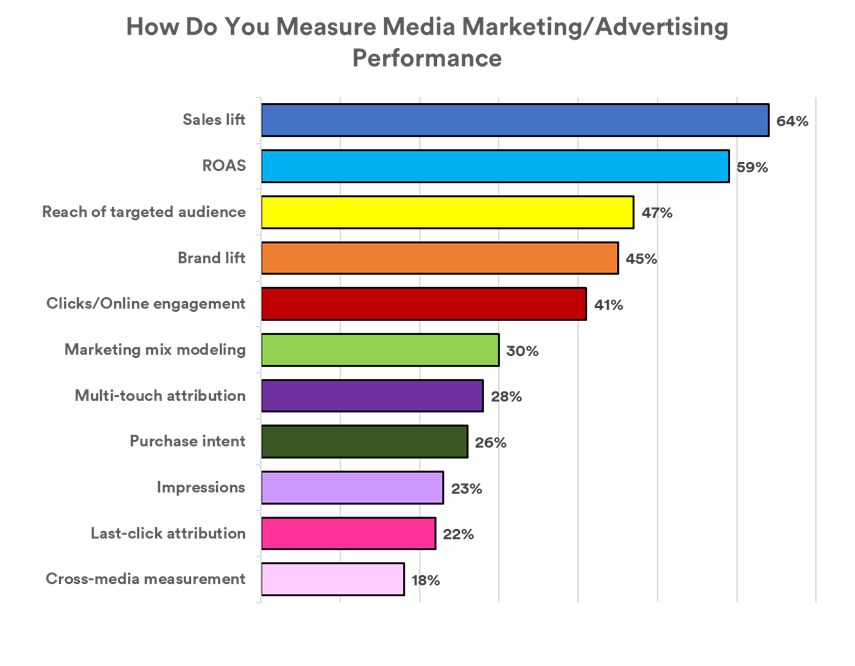
The study found that measuring Sales lift is the top way marketers evaluate advertising performance (64% of respondents). This was followed by Return on ad spend (ROAS, 59%), Reach of targeted audience (47%), and Brand lift (45%). Reach was the top “audience exposure” metric on the list, with impressions ranking 9th at 23%.
Less than a third of respondents said that they utilize Marketing mix modeling (30%), Multi-touch attribution (28%), and Last-click attribution (22%).
 According to this research, offering the right type of outcomes measurement will bolster confidence among media decision-makers – but not all outcome approaches are equal.
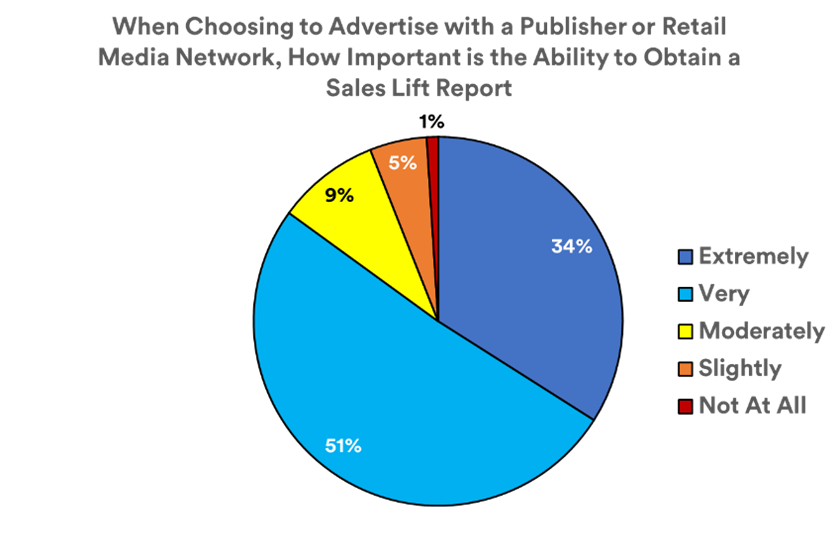
The importance of Sales Lift reporting cannot be overstated. 85% of respondents said it is either Extremely or Very Important they are able to obtain a sales lift report when working with a publisher or retail media network.
Attracting New Customers
The study uncovered that marketing leaders feel that marketing and advertising are very or extremely important to winning new customers (80%) and customer retention (52%).
The study recommends personalizing advertising and making brand engagements interactive. As the death of the cookie approaches, this is a unique opportunity for out-of-home (OOH) advertisers to use the advancements in audience targeting data available today. Additionally, OOH is in a superior position to many other media formats to interact with consumers while they are shopping and to curate unique experiences that can drive a customer to an online engagement.
The OOH industry has the capability to measure these interactions and the conversions that follow – whether online or off – to ensure marketing decision-makers have the confidence to invest in the OOH media channel again.
Key Confidence Drivers
The study found key differentiators between those marketing leaders who stated they were confident about their investments and those who did not.
The largest delta was among those who were conducting effective in-flight campaign optimization. 49% of those who said they are confident in their media investments felt that they are high performers of optimization in flight versus only 20% of those who are not confident in their investments.
Other differentiators included customer targeting and measuring campaign performance.
In-flight campaign optimization can be more challenging for OOH than other media channels, but it is certainly a possibility. The availability of near-real time metrics can empower advertisers to understand how their campaign is performing with more recency than ever before, and the ability to move creative, especially on digital formats, is simpler than ever.
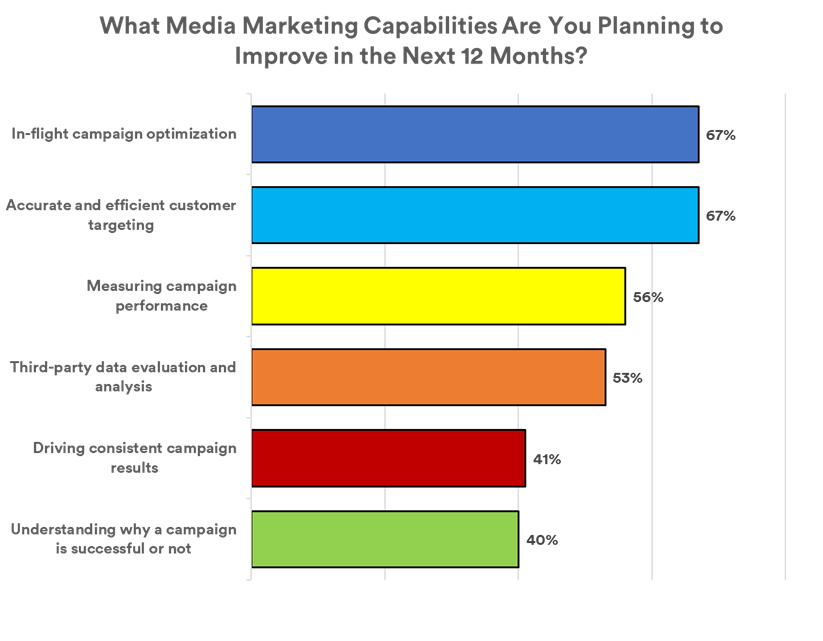 It is important to note that 67% of the marketers surveyed said that they plan to improve their in-flight campaign optimization work over the next 12 months. The growing focus on this practice can be an opportunity for companies in the OOH space who are willing and able to facilitate near-real time measurement and are capable of moving creative quickly and affordably.
OOH Data and The Knowledge Gap
The availability of data to the OOH industry has skyrocketed over the past few years and in some cases, surpassed those available in other media channels. The myriad of measurement methodologies, technological solutions, and increased granularity of metrics can be better leveraged to empower marketers to be more confident in their OOH investments.
Additionally, while the wealth of data available to the industry is undeniable, advertiser and agency knowledge of the existence of that data seems limited. Repeatedly, advertisers speak at industry events about the value of OOH as a channel but are frustrated by the lack of data and measurement solutions – while we, as onlookers in the audience, whisper to each other that the very solutions they are looking for are readily available.
The good news is that the hard part has already been done in OOH. The development, the testing, and the technology to facilitate measurement and analytics already exists. What is left for us to do is inform marketers that we have the tools they need to help drive their trust with data-driven OOH investments.
For more information on the CMO Council and NCSolutions study or to download the complete report, please visit this website.